Analytics and the sales performance report
Related guides
- Profit, commission and configuration reportsReports · 6 min
- Find your way around OrderPilotGet started · 7 min
- Credit salespeople on a quote or orderTeam and permissions · 5 min
- Hand over an order and choose who’s in the salesperson listTeam and permissions · 4 min
- Set up commissionTeam and permissions · 6 min
Use Analytics to review sales activity and export its reports. Check each report's counting rules before comparing its totals with Home or Shopify.
Analytics appears in the Shopify admin sidebar. Its title row has its own Store choice; the app's top-bar location picker does not filter it.
Analytics access and tabs
You need View Home and Analytics totals or a commission permission to open Analytics. Each tab then has its own requirements.
| Tab | What it answers | Permission needed |
|---|---|---|
| Sales | What was placed and quoted in the period, and who sold it | View Home and Analytics totals, plus View quotes and orders |
| Commission | What each credited person earned | View own commission or View all commission and profit |
| Profit | What sold, its cost and what remained, including the best-selling configurations | View all commission and profit, plus View costs |
| Warranty | Claims, their costs and coverage ending soon | View Home and Analytics totals, plus View warranty claims |
A person can see some tabs while another stays hidden. Read commission, profit and configuration reports for those tabs. Warranty work is covered with warranty claims.

Period, store and the Sales tiles
The title row is the same on every tab. Choose 7D, 30D or 90D, or Custom with From, To and Apply. The dates in use show beside the buttons.
The period and Store (All stores or one store) stay as you switch tabs. Export sits at the end of the row on tabs that export from there.
On Sales, the list after the period picks what it is compared with, such as vs previous 30 days. Each tile shows its change against that period.
| Tile | What it counts |
|---|---|
| Revenue | Placed orders after discounts and refunds, without tax or shipping. |
| Orders | Orders placed in the period. |
| Average order | Revenue divided by orders. |
| Quotes created | Quotes made in the period. Unfinished drafts do not count as quotes. |
| Converted | The share of this period's quotes that became orders, with the count beside it, such as 25 of 87. |
Below the tiles, Revenue and orders by day (by week or month for longer periods) draws this period's revenue beside the compared period's, with the order count as a line. Open quotes shows the value and number of quotes still open, and Top products the best sellers by revenue.
Keep different currencies separate when reviewing or exporting. The report presents currency-specific figures rather than combining unlike amounts.
Salespeople
The Salespeople table shows Salesperson, Quotes created, Converted, Conversion, Orders, Average order and Revenue, with a Total row. Click a column heading to sort by it. Unassigned appears last when some value has no credited salesperson.
A split sale contributes each person's sales-credit share to their revenue. Value without a credited salesperson goes to Unassigned, so the rows add up to the total revenue.
A quote counts for every person credited on it, so the people's quote counts can add up to more than the Total. A person's Orders counts only orders they earned credit on: a no-charge order, such as a warranty replacement, counts in the Total but in nobody's row.
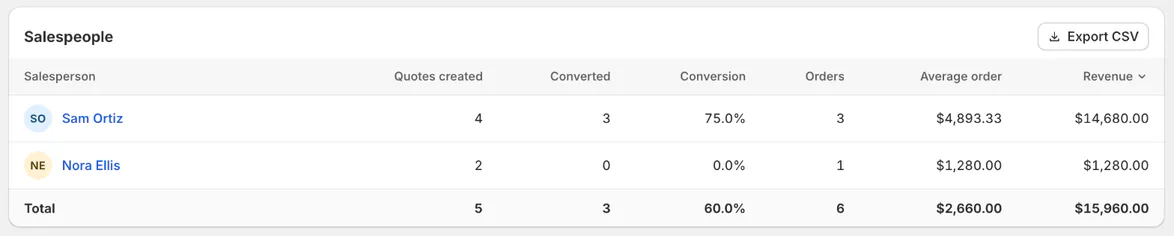
The primary salesperson owns the order. Use assignment management for who owns a record and commission setup for earning rules.
Export a report
Step 1: Choose the tab, period and store
Open the tab you need and set the period and Store in the title row. For Custom, enter the dates and click Apply.
On Commission, also check View by and the selected row. On Profit, check Group by. These choices decide what the export contains.
Wait for the updated results before exporting.
Step 2: Download the CSV
Each tab exports what it shows:
- Sales: Export in the title row downloads the period's revenue, orders and converted quotes beside the compared period. Export CSV on the Salespeople table downloads its rows and Total. Both filenames name the dates.
- Commission: Export for payroll downloads one row per salesperson as commission-payroll.csv. Export statement downloads the selected person's earned lines.
- Profit: Export downloads the chosen grouping, with a filename beginning profit-by.
- Warranty: Export CSV on Coverage ending in 90 days downloads cover-ending-soon.csv.
Step 3: Review the exported figures
Open the CSV in your spreadsheet and check the period, currency and selected filters before sharing it.
The payroll export can support a commission review, but first review the earning, refund and credit rules. Exporting a report does not pay commission.
A greyed export control explains whether results are loading or there is nothing for the current choices. Hover over it to read the next action.
Screen reference

Why totals differ
| Comparison | Difference to check |
|---|---|
| Home value tiles versus Analytics › Sales | Last-updated records versus quote and placed-order dates |
| Their date boundaries | UTC days for Home's value tiles; the shop's time zone for Analytics |
| Record totals versus Revenue | Revenue excludes tax and shipping and subtracts refunds |
| Sales versus Commission | Earning trigger, credit shares, rates and refund rules |
| Sales versus Profit | Cost completeness and the report's cost basis |
Do not change sales credit or costs merely to make different report types agree. First compare equivalent dates, currencies and definitions.
Example: a monthly sales review
Nora Ellis opens Analytics with 30D at Harlow & Finch Interiors. She reads the tiles against the previous 30 days, then reviews Sam Ortiz, her own row and Unassigned in Salespeople.
She checks that the revenue shares add up to the total for each currency. She does not add the salesperson quote counts to infer distinct customer quotes.
Nora exports the Salespeople CSV and keeps its range with the review. If Home's values differ, she checks last-updated records rather than treating the difference as a missing sale.
If something goes wrong
Analytics is missing
Check reporting access and look in the Shopify admin sidebar.
A tab is missing
Check the specific permission in the table above.
No quotes or orders appear
Choose another period and check the report's counting dates.
Export is unavailable
Wait for loading or choose filters with results.
The figures still differ unexpectedly
Send support the report names, periods, currencies and specific figures.
Was this guide helpful?
Thanks. Tell us what was missing at support@meetorderpilot.com.