Profit, commission and configuration reports
Related guides
- Analytics and the sales performance reportReports · 5 min
- Set up commissionTeam and permissions · 6 min
- Credit salespeople on a quote or orderTeam and permissions · 5 min
- Create and manage rolesTeam and permissions · 5 min
- How landed cost and cost layers workInventory and costs · 4 min
Read what each salesperson earned, what remained after costs and which configurations sold. Analytics also brings warranty claim activity and expiring coverage into one report.
Start with Analytics and Sales performance for navigation, shared periods and CSV basics. The reports here answer different questions, so their totals use different rules.
Access and report periods
| Report | Access required |
|---|---|
| Commission | View own commission for your own rows, or View all commission and profit for everyone |
| Profit, with its configurations | View all commission and profit, plus View costs |
| Warranty | View Home and Analytics totals, plus View warranty claims |
Warranty costs also require View costs. Starter-role defaults do not automatically grant commission rights; edit the role when staff need their own report.
Every tab reads the period and Store set in the Analytics title row: 7D, 30D, 90D or Custom, and All stores or one store. They stay as you switch tabs.
The app's top-bar location picker does not narrow these reports. Use the title row's Store instead.
Commission
Commission settings decide the earning trigger, basis and refund treatment. The report states that rule above the results, such as Earned when placed · Net merchandise, with Change to open the settings.
Step 1: Choose what to list
Pick View by: Salesperson, Order, Product or Category. The list on the left shows each one's earned commission, with All salespeople (or all orders, products or categories) at the top.
Search the list, or change Sort. A salesperson row shows their order count and current staff rate, or No rate set.
Step 2: Read the selected row
Click a row. Its panel shows three figures:
Figure What it shows Credited sales The person's share of sales in the period, after refunds. Earned Commission earned in the period, with refunds taken back when the rule says so. Not earned yet What open quotes from the period would earn. Earned lists each order with Customer, Placed, Share, Credited sales and Commission. Expand an order to see its items, with the code and rate each one earned at.
Not earned yet lists quotes with Quote value and Would earn. It is a forecast: do not add it to earned commission when preparing a payment review.
The staff rate under a person's name is today's rate. It is not proof that older earned lines used that rate, so check the items' own code and rate.
Use the panel's ⋯ menu for Change commission rate or View staff member, and the arrows to step to the next person.
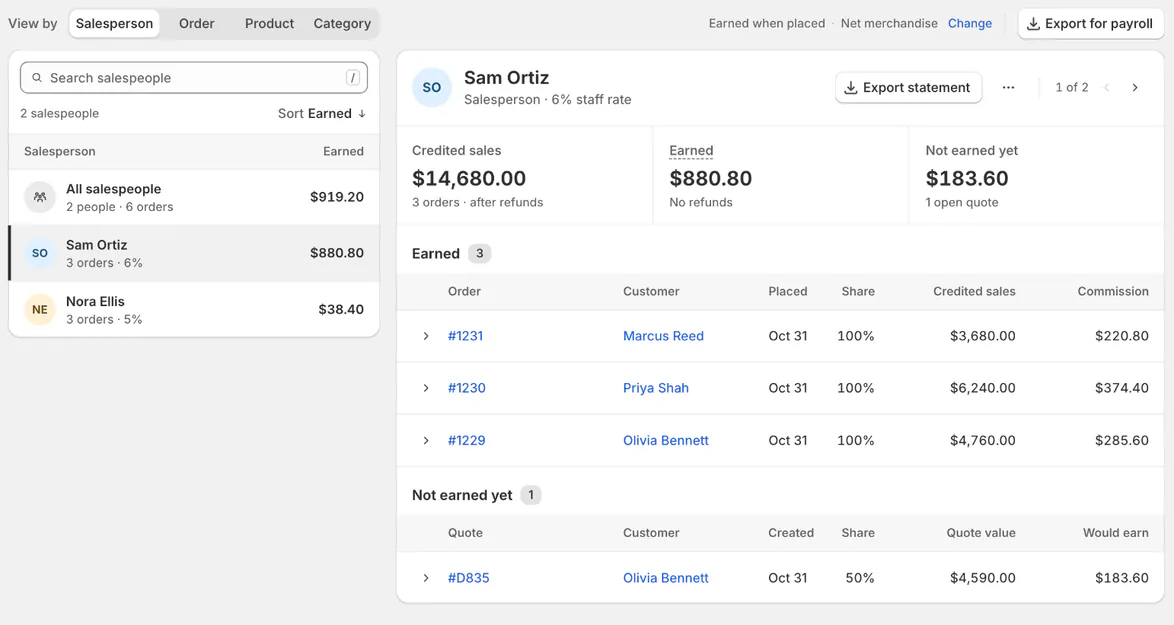
Inspect order lines when an earned rate differs from today's rate. Step 3: Export it
Export statement downloads the selected person's earned lines: order, customer, earned date, item, net, code, rate, share, credited sales, commission and any refund. On the Order, Product and Category views, Export downloads the selected row's orders.
Export for payroll downloads one row per salesperson: email, role, staff rate, orders, credited sales before and after refunds, commission, earned, not earned yet and the basis.
A person with View own commission sees only their own rows. If an export reaches its limit (500 salespeople, 2,000 orders or 5,000 lines), choose one store or a shorter period.
Profit
Profit considers orders placed during the period that are not cancelled. Days follow the shop's time zone.
Step 1: Choose a grouping
Pick Group by: Product, Template, Category, Vendor, Store or Configuration. A summary beside it counts the groups, units and orders.
Profit by day (or by week or month) stacks Net, Commission and Cost and freight for each day, with the Margin as a line.
Step 2: Read the table
The table has Units, Selling price, Cost, Freight, Commission, Net and Margin, with an All row on top. Hover a heading for its definition. Click a heading to sort, search the groups, or expand a group to see its lines.
Selling price is net merchandise after discounts and refunds, excluding tax, shipping and fees. Cost is the landed cost of the units sold, estimated until they are received; freight is shared out to the units on each purchase order.
Commission is what was earned on these sales, less refunds taken back. Net = selling price − cost − freight − commission, and Margin is net as a share of the selling price.
Review landed-cost methods before comparing a planned sale with one whose goods have been received and costed.
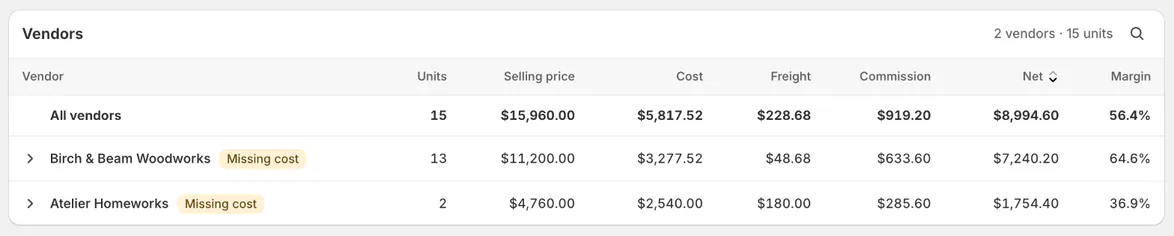
Read missing-cost badges alongside vendor margins. A Missing cost badge flags a group with lines that have no cost recorded: their net counts the whole selling price. Use cost corrections to fix the underlying records before relying on the margin.
Export in the title row downloads the chosen grouping. Its columns include lines without cost and whether cost was estimated.
Configurations
Configurations show the exact combinations customers bought: lines on the same template with exactly the same options.
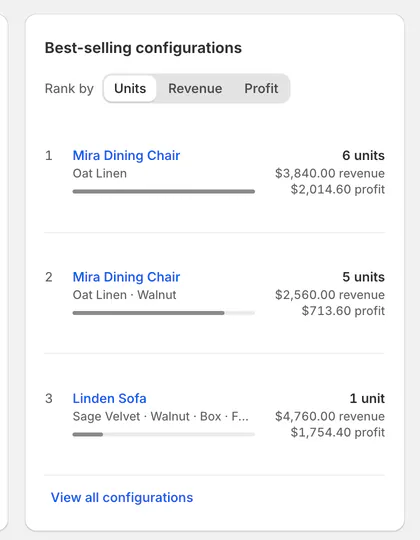
Best-selling configurations, beside the Profit chart, ranks the top combinations. Rank by sorts them by Units, Revenue or Profit, and each shows its revenue and profit.
Click View all configurations to group the Profit table by Configuration. That table, its sorting and its export then work as for any other grouping.
Warranty
Warranty combines current claims, resolution timing, costs and coverage approaching its end, for the period and store in the title row.
| Tile | What it tells you |
|---|---|
| Open claims | How many claims remain open, including those older than 14 days. |
| Median days to resolve | The middle resolution duration in the report. |
| Claim cost | Claim costs, amounts refunded or credited and recovery from vendors, subject to cost permission. |
| Order lines with a plan | Warranty-plan participation and associated plan sales. |
Below the tiles, review Open claims by status and age, Products with the most claims and Costs and reimbursements by vendor.
Coverage ending in 90 days counts the units whose cover ends soon. Export CSV lists them with Customer, Product, Order and Coverage ends. Its export contains Customer, Product, Order and Coverage ends.
Use claim handling to act on a case. The report summarizes the records; it does not approve a claim or issue a refund.
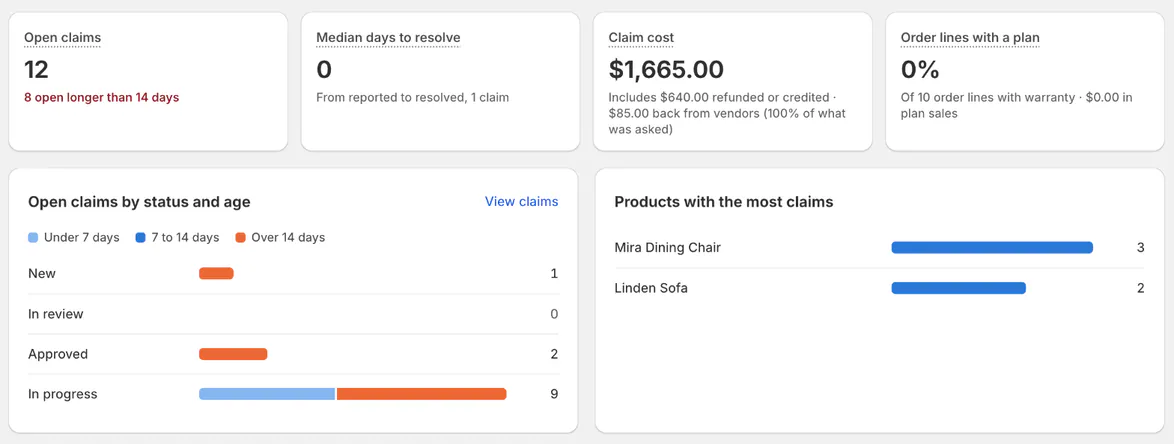
Example: what sells and what pays
Nora Ellis groups Profit by Vendor to compare Atelier Homeworks and Birch & Beam Woodworks. She checks the Missing cost badges before comparing margins.
Best-selling configurations shows the exact Mira Dining Chair and Linden Sofa combinations purchased, such as Oat Linen with Walnut legs. She ranks them by Profit before deciding which to feature.
Sam Ortiz opens Commission with personal viewing permission. He sees his earned orders and open quotes without gaining access to Nora's commission.
If something goes wrong
No commission appears
Check the period, store, View by row and earning trigger before changing rates.
Profit is unavailable
Check both all-commission-and-profit access and View costs.
Some lines have no cost
Record or correct their costs before treating the margin as complete.
No configurations appear
Choose All stores or a longer period; only template lines group into configurations.
Warranty says Costs are hidden
Ask someone with View costs to review the monetary figures.
Was this guide helpful?
Thanks. Tell us what was missing at support@meetorderpilot.com.